Biodiversity in Numbers
Summary
SiB Colombia is the national node of GBIF; its purpose is to provide open access to biological biodiversity information and promote its use.
Biodiversity in numbers is the synthesis of data available in the SiB Colombia portals; the objective of regionalization is to generate tools that allow access to relevant information on the biodiversity of the regions both to the community and to the people in charge of making decisions about the territories.
I played a significant role throughout the project, overseeing every step from the initial discovery phase to the eventual launch. I conducted data analysis, refined the interfaces, and facilitated collaboration between the development and design teams.
Team
SiB Colombia:
- 1 Product lead (me)
- 2 Designers
- 2 Developers
- 2 Data Scientists
- 1 Project Manager
Delivery
- Design System
- Responsive webapp
- GraphQL API
Time
16 sprints to version 1.1 and 12 sprints to version 1.2
Challenge
Data on biodiversity come from multiple sources: biological collections, inventories, monitoring, EIA, DNA barcodes, camera traps, remote sensing, participatory science, agrobiodiversity, and degree thesis, among others; however, this raw data does not meet the needs of all users interested in using it, and it is necessary to process and synthesize it so that it can be converted into valuable information for academics, politicians and researchers.
The main challenge was to create a product that resolved the transformation of data into relevant and easily understood information, minimizing the friction of the interested people and reducing the burden of queries to the SiB Colombia team.
Another critical challenge we faced as a team was to generate a scalable system considering the implementation of this same information window for the 32 departments of Colombia and other specific geographic areas.

SiB Colombia data portal, platform where all raw data published through the system is available.
Who do we design for?
The problem of accessibility to open data exists at different levels: the first, the generation of efficient processes for the collection and publication of these; second, the presentation and navigation of these data in a usable way and the third level, where we focus on Biodiversity in Numbers, is the value provided by information.
Not everyone has the same knowledge and needs when looking for information on Biodiversity. In this case, we identified through interviews with actors from different sectors, such as students, peasants, and politicians, that there is a constant need to consult immediate information without processing data to obtain information communicating the state of the regions.
So together with the communities, we defined a product that would help solve immediate questions through data synthesis and visualization.
Using methodologies based on a “deconstructed” design sprint with different types of users from multiple communities and states, we managed to define a product that fulfilled the users’ needs and complied with the objectives of the territorial government entities.

Design Sprint

Iterating to the heart of the problem
We had a design base of a product that frequent users consumed, so we took it as a reference to start exploring, asking, rebuilding and implementing design and development processes that allow us to continue scaling and creating derivative products for other regions.

Biodiversity in Numbers version 1.0

Redesign of Biodiversity in Numbers version 1.0

Wireframe home versión 1.1

Wireframe geographic viewer version 1.2

Mockup geographic viewer 1.2
Results
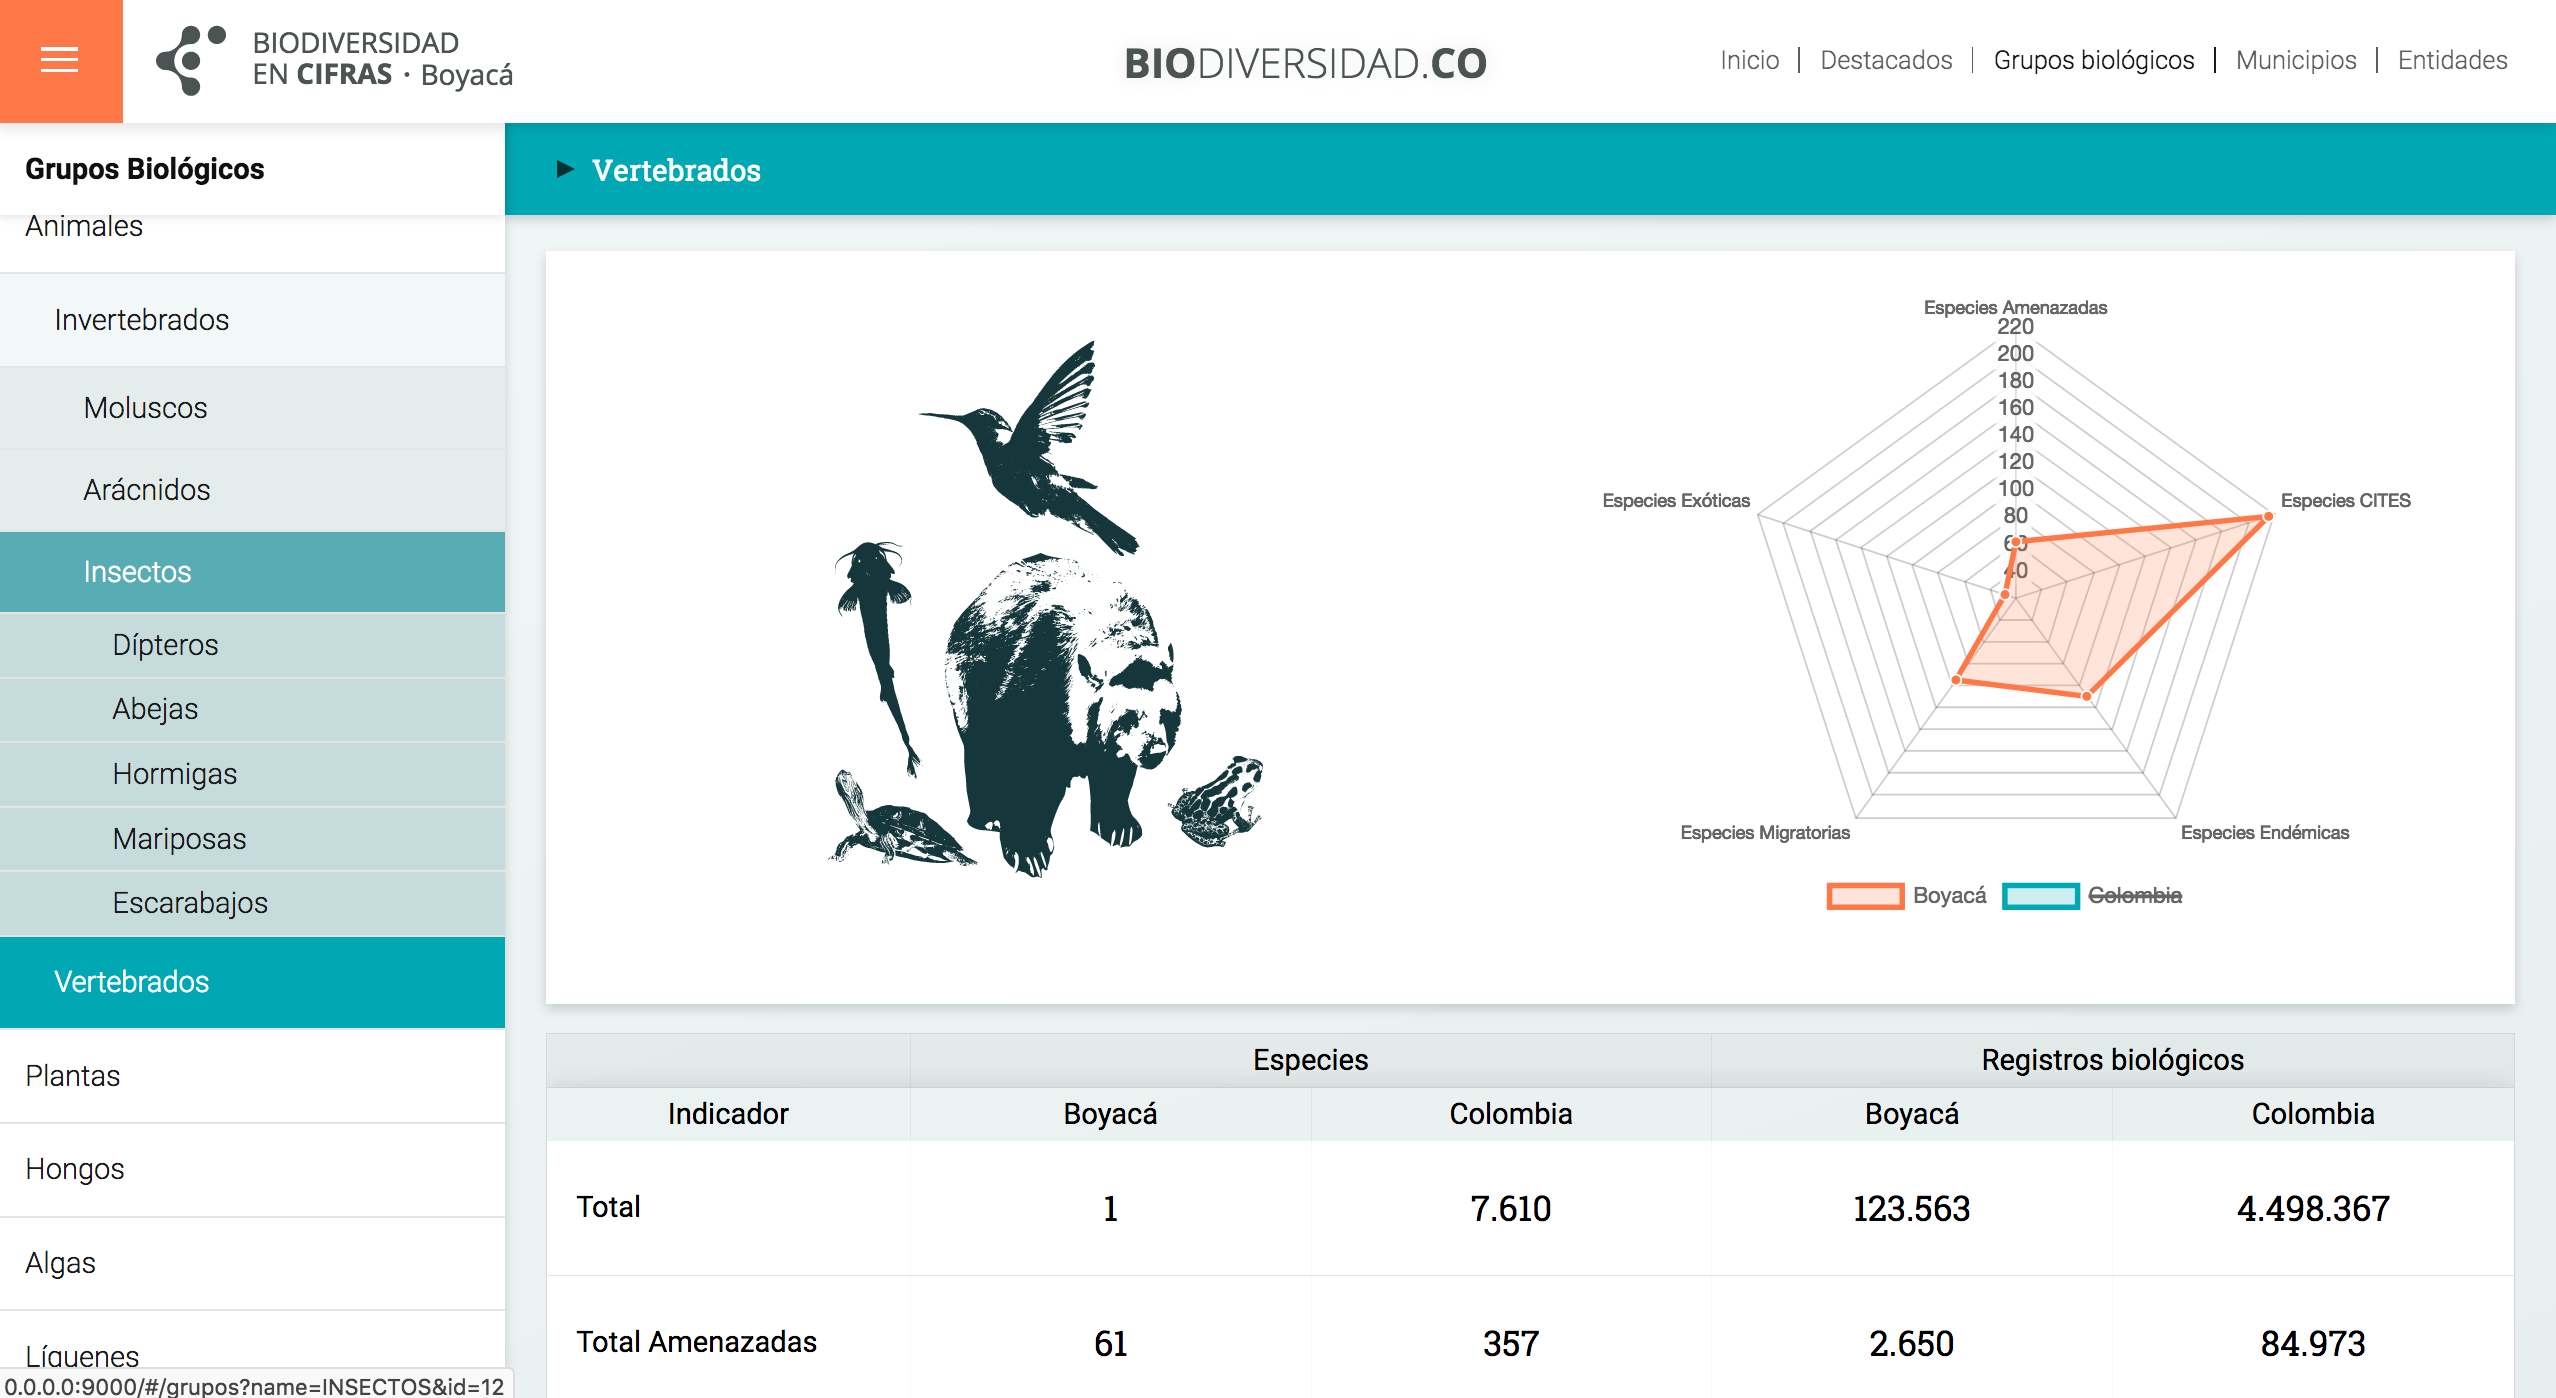
The first Biodiversity in Numbers to be published was implemented for the department of Santander Colombia. A few months later, usability updates were made for the department of Boyacá and later applied to Santander. Biodiversity in Numbers notably improved the reduction of queries that had to be resolved manually daily (from 20 daily to 5 weekly); in addition, two new instances are being implemented for other regions of the country since the tool improved the ease with which different entities can inform and sensitize the population about the value of biodiversity. And government entities and academics can consult data accurately for research projects.

Let's chat